The graph of the position x versus time t of a moving object is shown in figure 1 above . On which time interval(s) is the velocity of the moving object equal to zero?
A) (0 , 1)
B) (1 , 4)
C) (4 , 6)
D) (6 , 9)
E) (9 , 11)
The graph of the position x versus time t of a moving object is shown in figure 1 above . At what time was the object furthest from the origin (x = 0)?
A) t = 1 s
B) t = 4 s
C) t = 6 s
D) t = 9 s
E) t = 11 s
The graph of the position x versus time t of a moving object is shown in figure 1 above . Over which time interval(s) was the object moving in the negative direction?
A) (6 , 11)
B) (0 , 1)
C) (1 , 4)
D) (4 , 11)
E) (4 , 9)
The graph of the position x versus time t of a moving object is shown in figure 1 above . Over which time interval(s) was the object moving in the positive direction?
A) (0 , 1) and (9 , 11)
B) (0 , 6)
C) (1 , 4) and (6 , 11)
D) (0 , 4) and (4 , 9)
E) (0 , 11)
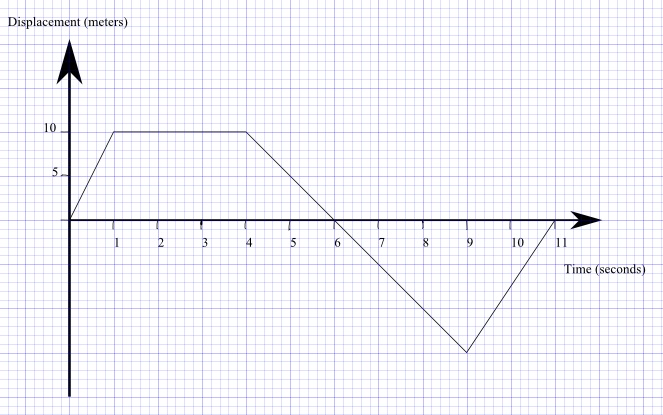
Question 5 to 10 refer to the displacement vs time below.

The graph of the velocity v versus time t of a moving object is shown in figure 2 above. What is the total displacement from t = 0 to t = 9 seconds?
A) -2.5 m
B) 2.5 m
C) 0 m
D) 9 m
E) 15 m
The graph of the velocity v versus time t of a moving object is shown in figure 2 above. What is the total distance covered by the object from t = 0 to t = 9 seconds?
A) 9 m
B) 5 m
C) 7.5 m
D) 30 m
E) 15 m
The graph of the velocity v versus time t of a moving object is shown in figure 2 above. What is the average velocity over the interval t = 0 to t = 9 seconds?
A) 0.6 m/s
B) 0 m/s
C) 5 m/s
D) 1.5 m/s
E) 9 m/s
The graph of the velocity v versus time t of a moving object is shown in figure 2 above. What is the average speed over the interval t = 0 to t = 9 seconds?
A) 1.7 m/s
B) 9 m/s
C) 5 m/s
D) 7.5 m/s
E) 15 m/s
The graph of the velocity v versus time t of a moving object is shown in figure 2 above. Over which time interval(s) was the object accelerating uniformly?
A) (6 , 9)
B) (4 , 6)
C) (3 , 4) and (6 , 7)
D) (0 , 1) and (7 , 9)
E) (0 , 9)
The graph of the velocity v versus time t of a moving object is shown in figure 2 above. Over which time interval(s) was the acceleration of the object equal to zero?
A) (1 , 4)
B) (4 , 7)
C) (1 , 4)
D) (6 , 9)
E) (1 , 3) and (4 ,6)
Question 11 to 12 refer to the displacement vs time below.

The graph of the acceleration v versus time t of a moving object is shown in figure 3 above. Over which time interval(s) was the object accelerating uniformly?
A) (0 , 9)
B) (0 , 2)
C) (2 , 4)
D) (2 , 9)
E) (4 , 8)
The graph of the acceleration v versus time t of a moving object is shown in figure 3 above. Over which time interval(s) was the object decelerating uniformly?
A) (0 , 2)
B) (2 , 4)
C) (8 , 9)
D) (4 , 8)
E) (2 , 9)